Cameron Friedrich · 20 October 2026
Savena Valley's Student-Led River Cleanup Crew Maps Hidden Pollution Hotspots Using DIY Sensors
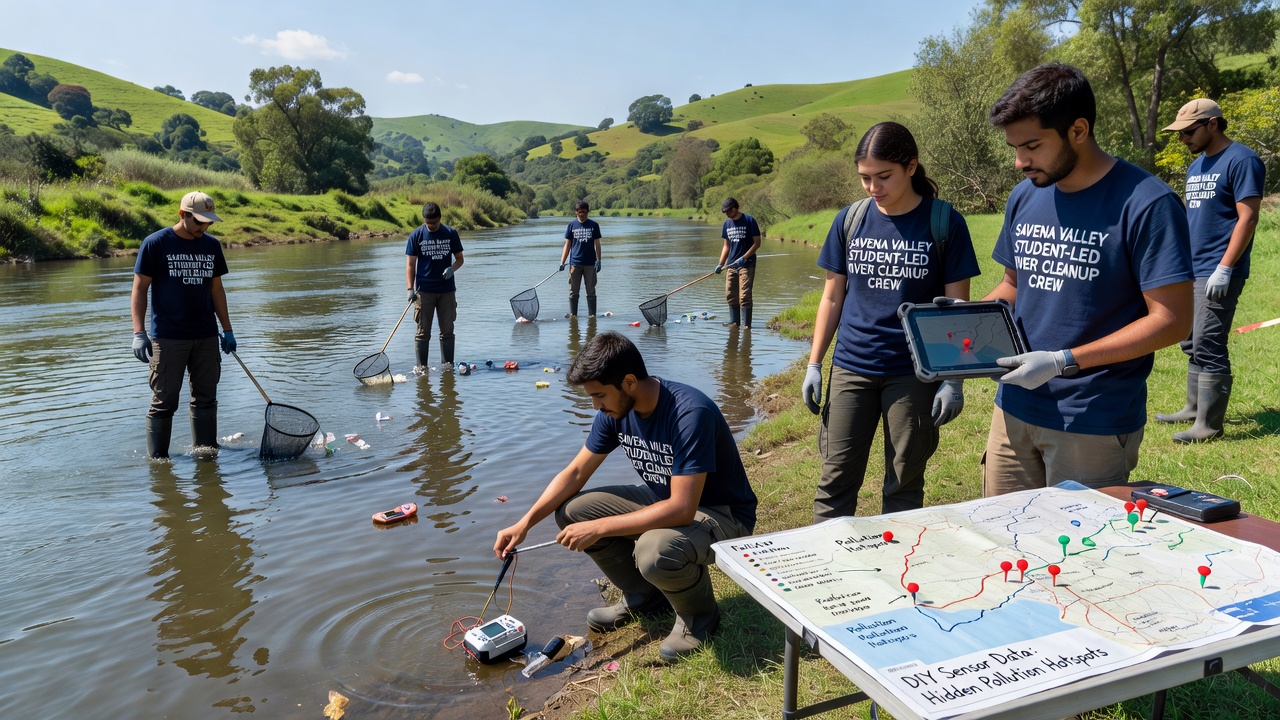
Students across Savena Valley have assembled a river cleanup crew that deploys low-cost DIY sensors to identify pollution sources previously missed by conventional monitoring, and their work has generated detailed maps that guide targeted remediation efforts throughout the region. The initiative began several years ago when local schools integrated environmental science projects with hands-on engineering, which allowed participants to build affordable devices capable of measuring parameters such as pH levels, dissolved oxygen, and heavy metal concentrations in flowing water.
Data collection occurs weekly along multiple tributaries, where teams place sensors at strategic points and retrieve readings that feed into a shared digital platform; this approach has revealed clusters of contamination near former industrial sites and agricultural runoff zones that standard government stations had overlooked. Observers note that the student-led mapping effort aligns with broader citizen science trends documented by agencies like the Environmental Protection Agency, whose water quality research programs highlight similar low-cost sensor applications in community settings.
Development of the Sensor Technology
Engineering clubs at several valley high schools collaborated with local universities to refine open-source designs for the sensors, incorporating microcontrollers, waterproof casings, and wireless transmission modules that send readings to a central database every fifteen minutes during active deployments. Calibration occurs through comparison with laboratory-grade equipment borrowed from partner institutions, ensuring accuracy within acceptable margins for preliminary hotspot identification, while the modular construction keeps individual unit costs below fifty euros and enables rapid repairs when components fail in the field.
Training sessions cover both assembly techniques and data interpretation, so participants learn to recognize anomalies such as sudden spikes in conductivity that often signal industrial discharge or fertilizer leaching. And because the project operates on a rotating schedule, new students join each semester and maintain continuity through documented protocols that previous crews established.
Mapping Process and Initial Findings
Once sensors log sufficient readings, teams upload the information to an interactive map that color-codes pollution intensity across the valley's waterways, revealing patterns that shift seasonally and after rainfall events. Researchers discovered that certain stretches near the northern tributaries consistently showed elevated nitrate levels tied to upstream farming practices, whereas southern sections closer to older manufacturing zones recorded higher traces of lead and zinc.
The second image illustrates one such deployment site where students calibrate units before lowering them into the current.
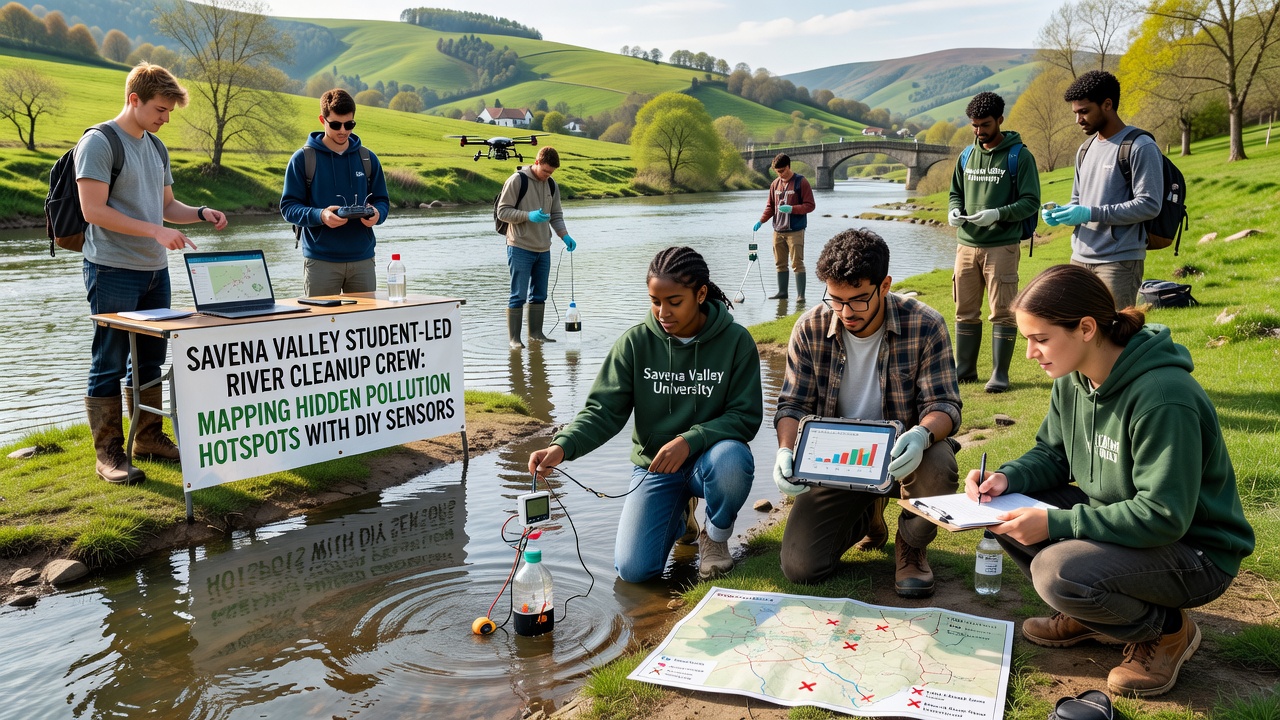
Cross-referencing these maps with historical records from the European Environment Agency has allowed crews to prioritize cleanup at sites where contamination exceeds established thresholds, and the resulting datasets now contribute to regional planning meetings held by municipal authorities. What's interesting is how the granularity of student-collected information complements broader surveys conducted by national bodies, filling gaps between fixed monitoring stations spaced several kilometers apart.
Community Integration and October 2026 Updates
Local residents participate through public data portals that display live readings, and schools host demonstration days where families examine the sensors and review mapped results; this transparency has encouraged additional volunteers to join sampling rotations and report visual evidence of debris accumulation that aligns with sensor alerts. In October 2026 the crew plans to expand coverage to two previously unmonitored tributaries after securing grants for additional sensor batches, which will extend the network by roughly eight kilometers and incorporate temperature probes to track thermal pollution from stormwater outflows.
Partnerships with regional agricultural cooperatives have also emerged, allowing farmers to adjust irrigation schedules based on downstream readings and reduce nutrient loading before it reaches the main river channel. Data from these collaborative efforts feeds into reports shared with academic networks studying citizen science efficacy across varied European watersheds.
Challenges Encountered and Solutions Implemented
Equipment durability presented early hurdles when heavy rains dislodged units or sediment clogged intake ports, yet iterative redesigns using reinforced mounts and self-cleaning mechanisms resolved most issues within the first two seasons of operation. Battery life limitations prompted the addition of small solar panels on sensor housings, which now sustain continuous operation for up to three weeks without manual intervention.
Coordination across multiple schools required standardized data formats and shared calibration schedules, and the adoption of open-source software platforms has streamlined these logistics while permitting external researchers to validate findings against independent datasets. Observers note that similar projects in other regions, including initiatives supported by Environment and Climate Change Canada, demonstrate comparable adaptations when communities confront variable field conditions.
Conclusion
The student-led mapping project continues to generate actionable intelligence that informs both immediate cleanup actions and longer-term policy discussions within Savena Valley, and its open methodology invites replication by other communities facing comparable water quality challenges. Ongoing refinements to sensor networks and data-sharing practices ensure that the effort remains responsive to new contamination sources as they appear, while educational components prepare successive generations of participants to sustain the work.